Debug Overlay
Category: SDL Adventure Game
I have developed a set of functions to easily draw shapes on the screen for debugging purposes.
For instance, I want to visualize the position and size of hotspot rectangles on the screen. These hotspots are areas that react to mouse clicks, such as the gate hotspot in the playground entrance scene, which is an area that accepts mouse clicks to interact with the gate object.
The debug overlay can be enabled by pressing the d key. Below is an example of the debug overlay in the playground entrance scene:
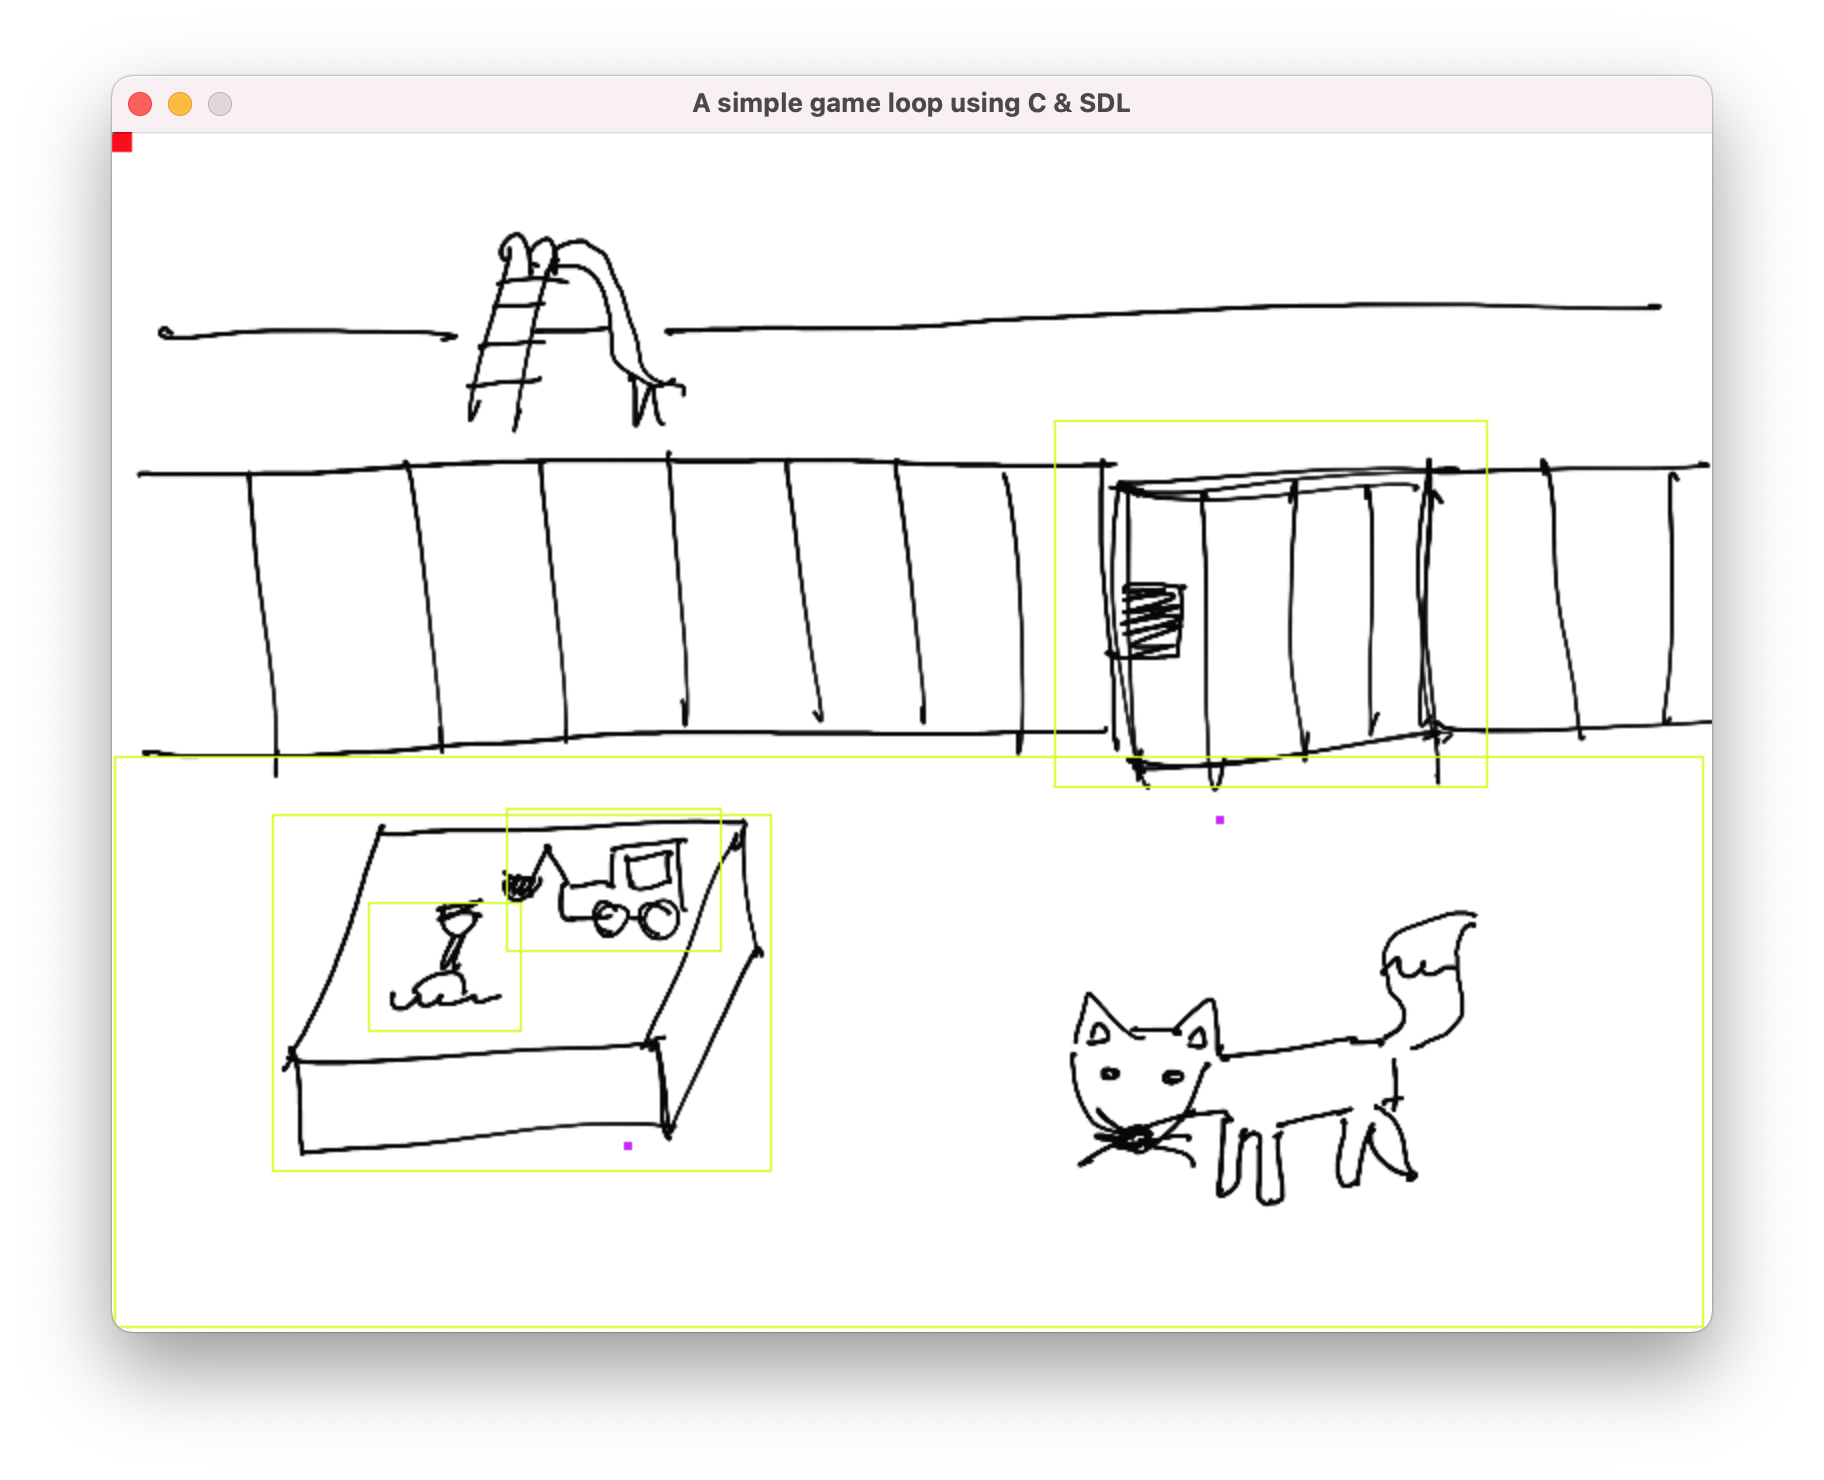
The debug functions are organized into a new debug.h/debug.c library. This library includes a process_input function to handle user events and a render function to display the debug overlay on the screen. Both functions are called during each iteration of the game loop, regardless of which scene is active.
I added four new fields to the Scene type: SDL_Rect *hotspots, int hotspots_length, SDL_Point *pois, and int pois_length. Hotspots are areas defined by rectangles on the screen, whereas Points of Interest (POI) are single points on the screen. POIs are used, for example, to determine where the main actor should move when interacting with a particular object in the scene.
The debug overlay’s render function collects hotspots and POIs from the current scene and renders them on the screen. Additionally, the process_input function handles mouse events to draw new shapes on the screen and outputs the resulting geometry to the standard output.