The Daily Checklist: Visualizing One Year of 'Things'
I always thought one year was a fairly long amount of time, but then I tried to draw each day of the year as a square in a grid.
Visualizing each day in a year put things into perspective and made it clearer how valuable each moment is.
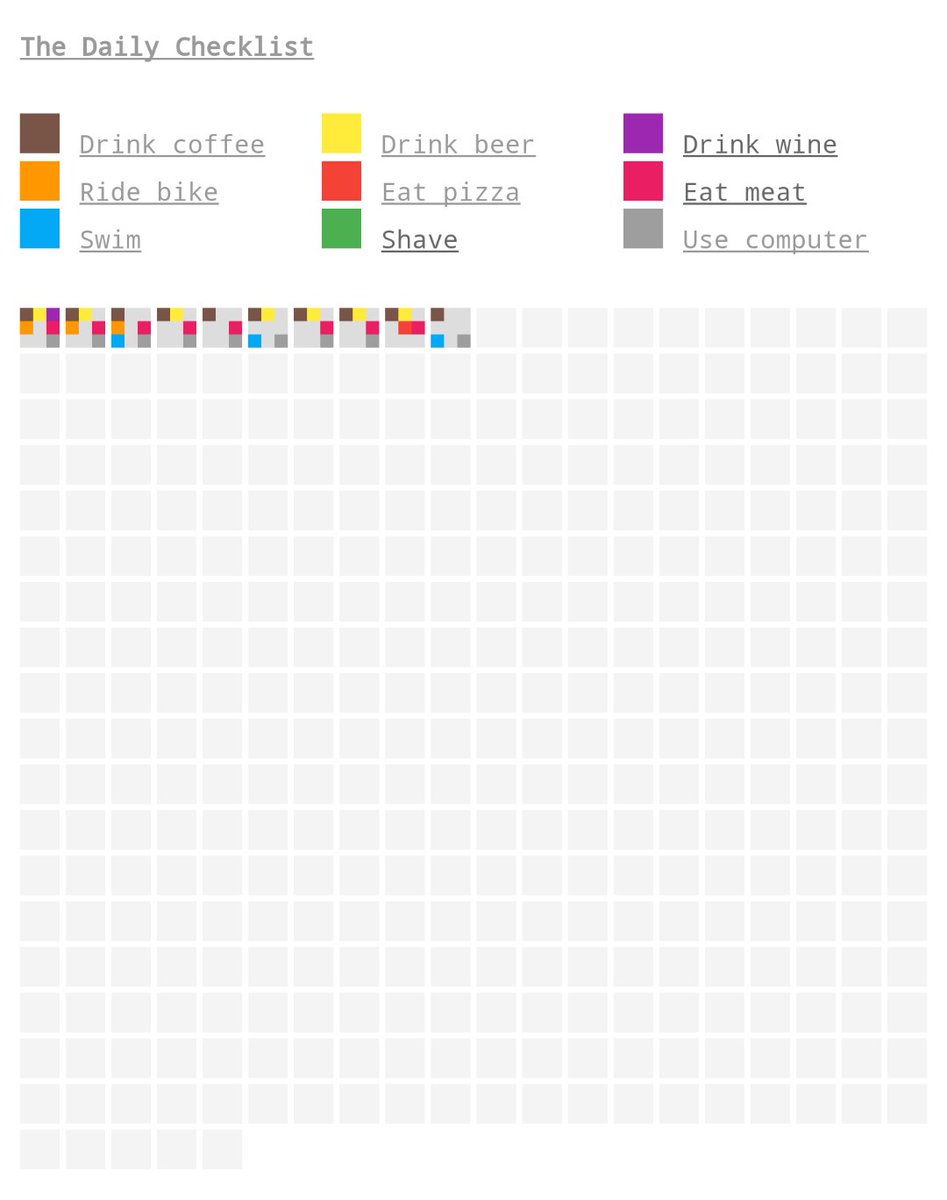
To add content to this visualization, I started tracking a collection of things I could do on an average day. I thought it would be interesting, once a year of data was collected, to look at the whole picture and try to recognize patterns.
The project started on 04/23/2016 and will end one year later, on 04/22/2017. During this period, I am using a custom Android app to track the things I do every day. The app posts each completed task to an HTTP API written in Go and running on Google App Engine.